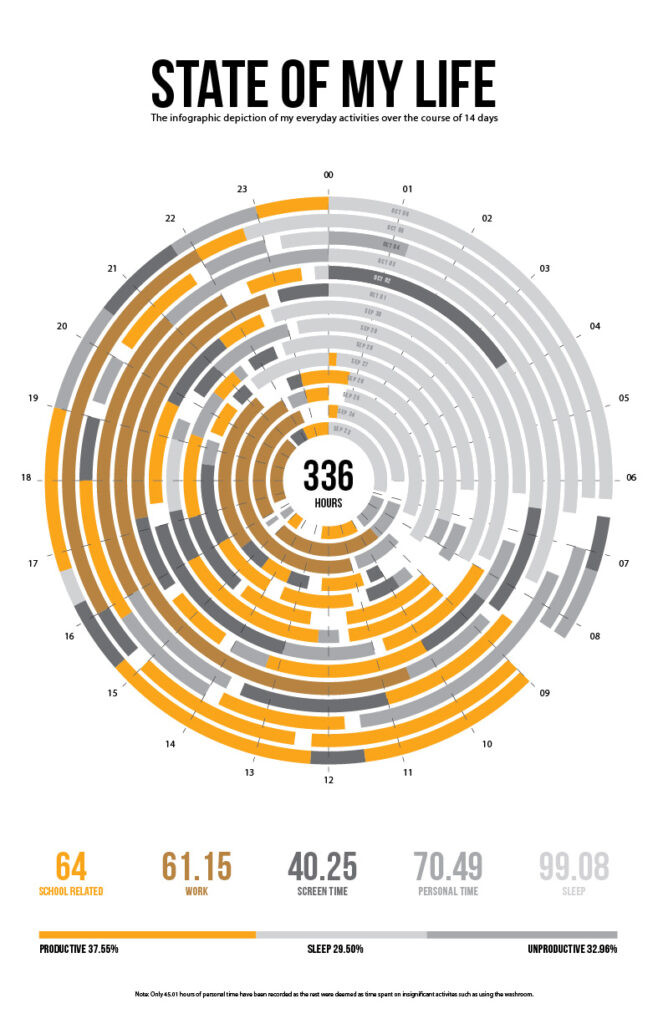
In the fall of 2021, amid the persistent shadows of the pandemic, I embarked on a journaling journey, meticulously chronicling my activities over a span of 14 days, from September 23rd to October 6th. This endeavor, initially conceived as a mere school assignment, evolved into an eye-opening exploration of my time, revealing intricate patterns and illuminating revelations about my daily life.
The assignment, seemingly straightforward at its onset, demanded a level of introspection and meticulousness that I hadn’t anticipated. It required me to document each waking hour, dissecting my days into fragments of productivity, leisure, and rest. Little did I know, this exercise would unfold layers of insight into the dynamics of my routine during these unprecedented times.
One critical aspect that emerged prominently from the chronicles of my days was the delineation of time across various spheres. The pages of my journal unveiled a staggering revelation—my life encapsulated within the measured ticks of the clock. During these 14 days, the hours seemed to cascade into compartments: education, sustenance, recreation, slumber, and personal time.
The stark reality reflected through my entries was a testament to the demanding nature of my responsibilities. As a student navigating the realm of remote learning, the digital corridors of online classes and assignment deadlines consumed a substantial portion of my waking hours. Approximately 64 hours unfurled dedicated to academic pursuits, a testament to the relentless pursuit of knowledge even in the face of a tumultuous external environment.
Simultaneously, I found myself straddling the demands of financial independence. My part-time work, an essential means of sustenance, claimed an additional 61.15 hours—a testament to the dedication required to fulfill the necessities of life amidst these trying times.
The omnipresent glow of screens, a ubiquitous companion in this digital era, accounted for 40.25 hours. Amidst the educational endeavors and professional commitments, moments of respite manifested in the form of leisurely scrolls through the digital realm—a brief escapade into the vast expanse of information and entertainment.
However, amidst the structured segments of time dedicated to academia and livelihood, the sanctity of rest nestled comfortably in my routine. Sleep, an indispensable elixir for the body and mind, claimed 99.08 hours—a testament to the acknowledgment of its paramount importance in nurturing vitality and resilience.
Yet, amidst these obligations and periods of repose, a modest allowance of 70.49 hours was nestled within my days—a sliver of time devoted solely to myself. A space where the boundaries blurred, and I could embrace spontaneity, indulge in passions, or simply revel in the bliss of unstructured moments.
Exploring Visual Representation
In the pursuit of crafting a comprehensive depiction of my activities, I delved deeper into the process of visual representation. Recognizing the potency of visual mediums, I engaged in the art of rough hand sketches. These preliminary renditions served as a conduit for brainstorming, fostering a creative dialogue between ideas and imagery.
Transitioning from the realm of rough hand sketches, I ventured into the digital domain, where monochromatic manifestations of three selected concepts took form. This monochromatic rendition, utilizing a singular color palette with an array of tints and shades, served a crucial purpose—providing a neutral ground for meticulous evaluation before the infusion of vibrant colors.
The strategic use of a monochromatic palette offered a platform for unbiased scrutiny and comparison. By eschewing the complexities of a full spectrum of colors, it facilitated an unobstructed assessment of design elements and conceptual nuances. This intentional restraint allowed me to discern the nuances within each representation, enabling a focused evaluation to select the absolute best depiction of my activities.
From the monochromatic explorations emerged two favored concepts and then one, now adorned with the richness of a diverse color spectrum. This infusion of varied tones and shades marked a pivotal phase in the journey towards encapsulating my activities within the confines of an infographic.
The transition from monochrome to vibrant hues wasn’t merely an aesthetic evolution; it was a deliberate progression towards refining the chosen representations. Each color, carefully selected within the broader spectrum, accentuated the nuances previously identified in the monochromatic renditions. These hues breathed life into the visuals, enhancing their communicative power and resonance.

The evolution from rough sketches to polished digital representations culminated in the discernment of an optimal form—an infographic that could best articulate the complexity of my activities. The amalgamation of design elements, nuanced tones, and visual storytelling techniques converged to birth an embodiment of my days—a visual testament encapsulating the rhythm and dynamics of my routine.
This meticulous progression from monochrome to vibrant hues underscored a transformative journey—a transition from neutrality to vividness, from restraint to expression. It illuminated not only the significance of color but also the importance of methodical evaluation in the pursuit of selecting the most resonant and impactful representation of my activities.


